Connected Visualization
Web HMI & Remote Dashboards
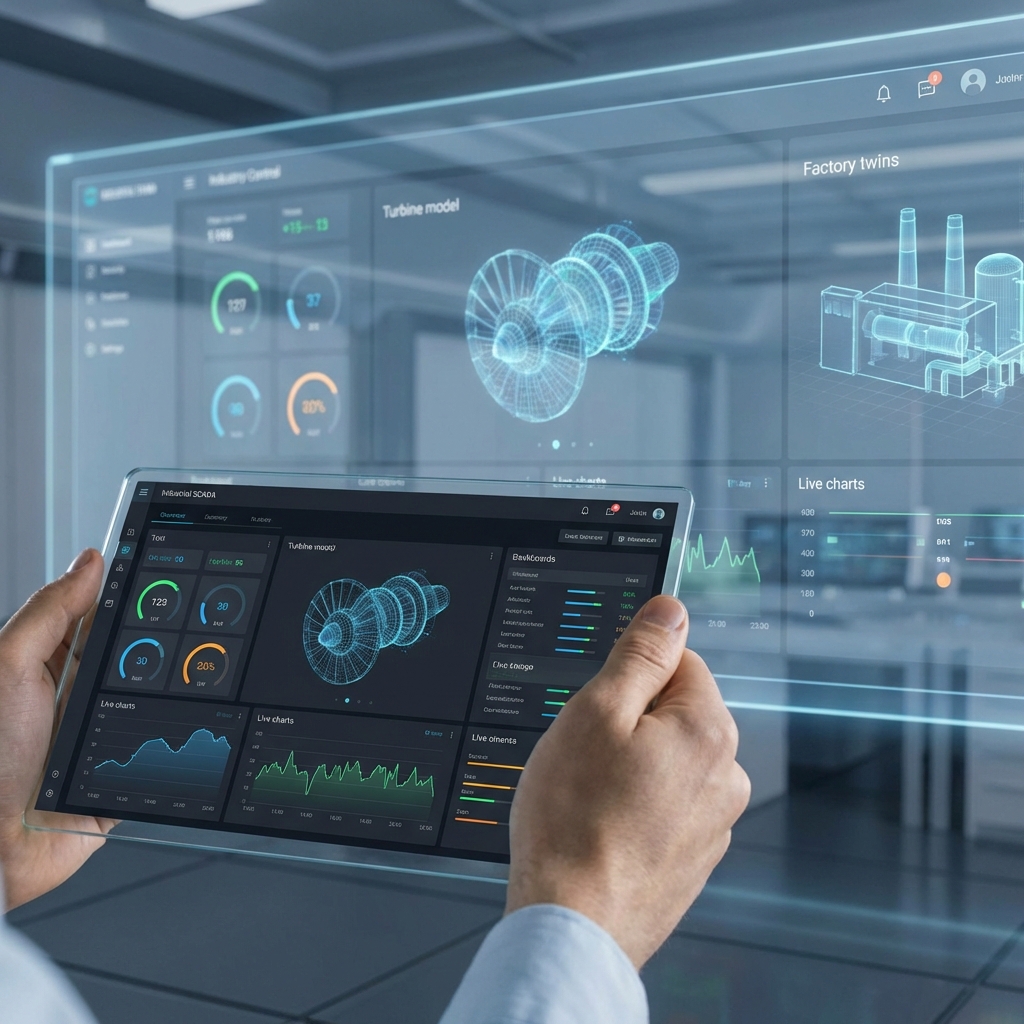
Responsive, browser-based visualizations that deliver live OT data securely to any device—empowering operators, managers, and remote teams alike.
Capabilities
Industrial Dashboards Designed for Every Screen
Modern, secure web experiences that extend the value of your PLC and SCADA investments.
Responsive Interfaces
Design HMIs and dashboards that adapt to desktops, tablets, and mobile devices without compromising clarity or performance.
Workflow-Driven UX
Map operator and management tasks into intuitive navigation, contextual KPIs, and multilingual interfaces.
Real-Time Data & Alarms
Leverage MQTT, WebSockets, and historians to stream live values, events, and notifications to authorized users.
Secure Remote Access
Implement VPNs, role-based permissions, and TLS encryption so remote visibility never compromises production security.
Edge & Cloud Deployment
Host solutions on industrial PCs, virtual machines, or the cloud using Docker, Node-RED, Ignition Perspective, or ThingsBoard.
System Integrations
Connect PLCs, historians, MES, and analytics platforms through MQTT, REST APIs, OPC UA, and SQL databases.
Deliverables
Dashboards Built for Decision-Makers
UX & Visualization Design
Facilitate workshops, personas, and prototypes to define screen layouts, alarm priorities, and multilingual content.
Data Pipeline Engineering
Normalize tags, contextualize data models, and implement store-and-forward logic for reliable performance.
Deployment Playbooks
Deliver containerized builds, documentation, and knowledge transfer so your team can operate and evolve the system.
Web HMI Project Roadmap
Step 1: Discovery & UX Planning
Interview stakeholders, document workflows, and prioritize KPIs to design experiences that match real-world tasks.
Step 2: Data & Integration Architecture
Define data models, security policies, and infrastructure—bridging PLCs, historians, and enterprise systems.
Step 3: Development & Validation
Build dashboards, configure alarm logic, and run simulations with production data for performance assurance.
Step 4: Deployment & Enablement
Roll out secure access, train users in English and Spanish, and establish support plans for continuous improvement.
FAQs
Frequently Asked Questions
Answers to the most common questions about web-based HMIs and remote dashboards.
Do web HMIs replace our existing SCADA?
They can complement or extend your current SCADA. I often layer web dashboards on top of existing systems to improve accessibility while maintaining your proven control infrastructure.
Which technologies do you use for web dashboards?
Ignition Perspective, Node-RED, ThingsBoard, Grafana, custom React/TypeScript front-ends, and secure MQTT or REST integrations—selected to match your requirements and IT standards.
How is security handled for remote users?
Role-based access, VPN or Zero Trust gateways, TLS certificates, and audit trails ensure only authorized personnel can interact with critical data.
Can dashboards function with intermittent connectivity?
Yes. I implement buffering, store-and-forward logic, and graceful fallbacks so operators maintain visibility even when networks drop.
Will our team be able to maintain the solution?
Absolutely. I provide documentation, training sessions in English and Spanish, and optional ongoing support packages.
Ready to extend your HMI to the web?
Let’s build secure, responsive dashboards that give every stakeholder real-time insight into your production.